

Methods for measuring the brightness of the night sky
Traditional methods of observation
Observation methods rely on the observation of astronomical objects in the night sky ("polluted" one), and the estimation of its brightness on this base, so they are called the astronomical methods. Their advantage is primarily a low cost and the possibility of carrying it anywhere. The advantages may also include the possibility of using the archive observations that were not intentionally aimed to the light pollution estimations, and therefore are fully objective.
To those methods may be included the observation scale assessing their level of light pollution, proposed by RL Berry[3]. This scale is based on the simple observation of sky and does not require much experience observation. It contains six levels:
- the sky surface brigntness 21,7 mag/arcsec2 - the sky is crowded with stars, extending to the horizon in all directions. In the absence of haze the Milky Way can be seen to the horizon. Clouds appear as black silhouettes against the sky. Stars look large and close;
- the sky surface brigntness 21,6 mag/arcsec2 - essentially as above, but a glow in the direction of one or more cities is seen on the horizon. Clouds are bright near the city glow;
- the sky surface brigntness 21,1 mag/arcsec2 - the Milky Way is brilliant overhead but cannot be seen near the horizon. Clouds have a greyish glow at the zenith and appear bright in the direction of one or more prominent city glows;
- the sky surface brigntness 20,4 mag/arcsec2 - to a city dweller the Milky Way is magnificent, but contrast is markedly reduced, and delicate detail is lost. Limiting magnitude is noticeably reduced. Clouds are bright against the zenith sky. Stars no longer appear large and near;
- the sky surface brigntness 19,5 mag/arcsec2 - Milky Way is marginally visible, and only near the zenith. Sky is bright and discoloured near the horizon in the direction of cities. The sky looks dull grey;
- the sky surface brigntness 18,5 mag/arcsec2 - stars are weak and washed out, and reduced to a few hundred. The sky is bright and discoloured everywhere.
Now commonly used is the Bortle scale [7]:
- Class 1: Excellent dark-sky site. Zodiacal light, gegenschein, zodiacal band visible; M33 direct vision naked-eye object; Scorpius and Sagittarius regions of the Milky Way cast obvious shadows on the ground; airglow is readily visible; Jupiter and Venus affect dark adaptation; surroundings basically invisible. Such sky is only at the equatorial area.
- Class 2: tTypical truly dark site. Airglow weakly visible near horizon; M33 easily seen with naked eye; highly structured summer Milky Way; distinctly yellowish zodiacal light bright enough to cast shadows at dusk and dawn; clouds only visible as dark holes; surroundings still only barely visible silhouetted against the sky; many Messier globular clusters still distinct naked-eye objects. According to the Polish astronomers, such conditions occur only in the north-eastern and south-eastern Poland (Bieszczady).
- Class 3: rural sky. Some light pollution evident at the horizon; clouds illuminated near horizon, dark overhead; Milky Way still appears complex; M15, M4, M5, and M22 distinct naked-eye objects; M33 easily visible with averted vision; zodiacal light striking in spring and autumn, color still visible; nearer surroundings vaguely visible. The sky in this class was recorded within about 30 km north of Cracow.
- Class 4: rural/suburban transition. Light pollution domes visible in various directions over the horizon; zodiacal light is still visible, but not even halfway extending to the zenith at dusk or dawn; Milky Way above the horizon still impressive, but lacks most of the finer details; M33 a difficult averted vision object, only visible when higher than 55°; clouds illuminated in the directions of the light sources, but still dark overhead; surroundings clearly visible, even at a distance. In the area of Cracow this is the sky about 22 km from the city center at the Jerzmanowice village (measuring point JER).
- Class 5: suburban sky. Only hints of zodiacal light are seen on the best nights in autumn and spring; Milky Way is very weak or invisible near the horizon and looks washed out overhead; light sources visible in most, if not all, directions; clouds are noticeably brighter than the sky. These conditions meet the sky in Mogilany, 14 km south of Krakow (measuring point MOG).
- Class 6: bright suburban sky. Zodiacal light is invisible; Milky Way only visible near the zenith; sky within 35° from the horizon glows grayish white; clouds anywhere in the sky appear fairly bright; surroundings easily visible; M33 is impossible to see without at least binoculars, M31 is modestly apparent to the unaided eye.
- Class 7: suburban/urban transition or Full Moon. Entire sky has a grayish-white hue; strong light sources evident in all directions; Milky Way invisible; M31 and M44 may be glimpsed with the naked eye, but are very indistinct; clouds are brightly lit; even in moderate-sized telescopes the brightest Messier objects are only ghosts of their true selves.
At a full moon night the sky is not better than this rating even at the darkest locations with the difference that the sky appears more blue than orangish white at otherwise dark locations. . - Class 8: city sky. Sky glows white or orange - one can easily read; M31 and M44 are barely glimpsed by an experienced observer on good nights; even with telescope, only bright Messier objects can be detected; stars forming familiar constellation patterns may be weak or completely invisible. These conditions meet the majority of estates in Cracow (eg measuring point KPO).
- Class 9: inner-city sky. Sky is brilliantly lit, with many stars forming constellations invisible and many weaker constellations invisible; aside from Pleiades, no Messier object is visible to the naked eye; only objects to provide fairly pleasant views are the Moon, the planets, and a few of the brightest star clusters..
These methods are useful for assessing the quality of the night sky by an amateur astronomer. However, they are not very precise, so for a long time have developed more sophisticated observation methods, however, required some experience and preparation. The simplest method of observation is to determine the number of a naked eye visible stars in a specific area of the sky. Such methods were used during the measurements over the large areas of Japan. In this case, were counted the stars in the Pleiades open cluster in the area surrounded by six brightest stars of this cluster (this is one of the more popular areas in the counting method) and in the area of the triangle in the Lyra constellation, designated by the stars α Lyr, ε Lyr i ζ Lyr [47] . These counts were performed with a binoculars. A little more difficult, but the most common method of estimation the light pollution level is the determination of the so-called limiting magnitude of the observed stars. It is based on the search for the faintest star visible in the specified area of the sky using the averted vision . As in the previous method, the observed area has to be rich in stars of different magnitudes, so as the determined limiting magnitude was most accurate.
The mentioned above averted vision method is based on the observation using the peripheral vision. It involves not looking directly at the object, but looking a little off to the side, while continuing to concentrate on the object. The banks of the retina, much richer in the more sensitive rods from cones, are responsible for night vision. Due to the slow response of the rod to the light this method requires a preliminary, at least twenty-minute adaptation of the eye to darkness, and it is recommended that there are no strong source of light in the neighbourhood, even obstructed, because in this case the eye captures light scattered around such light sources.
The near light sources also directly affects the measured value, as a result of scattering lighting up the local sky background, thus introducing bias into the measurement. The effect is the stronger the more dirty or hazy atmosphere is, because with the increasing scattering of light the apparent brightness of the near light sources increases along with the dimming of the distant ones.
Another negative phenomenon affecting the visual estimates is the turbulence in the lower atmosphere. This can be seen as the flickering of stars. This effect is strongest in the evening along with the cooling the atmosphere and in the course of the night it wears off until the achievement of the equilibrium state of the atmosphere . The stars seem cleare and brighter then. Thus the turbulences cause the reducing of the magnitude limit of faint stars, but without changing the surface brightness of the sky. This cause a systematic error of measurement[56].
In order to eliminate these difficulties, frequently were used the mixed measurement techniques, ie the visual observations were aided with simple devices, enabling to assess the brightness of the background sky directly in a visual way.
Own observation method - the cometary method
Own observation method of assessing the brightness of the night sky (called the cometary method) is based on the estimations of the surface brightness of the faintest blurred objects visible in the sky.
This brightness should be almost equal, but in fact it is slightly larger than the surface brightness of the night sky.
It is important, however, that the objects selected for analysis have brightness distribution as flat as possible, without any highlighted maximum - this is the reason why for this purpose not suitable are such objects as galaxies, clusters and nebulae. However, there is a class of astronomical objects, many of which meet the above condition, and which are commonly observed. These are comets.
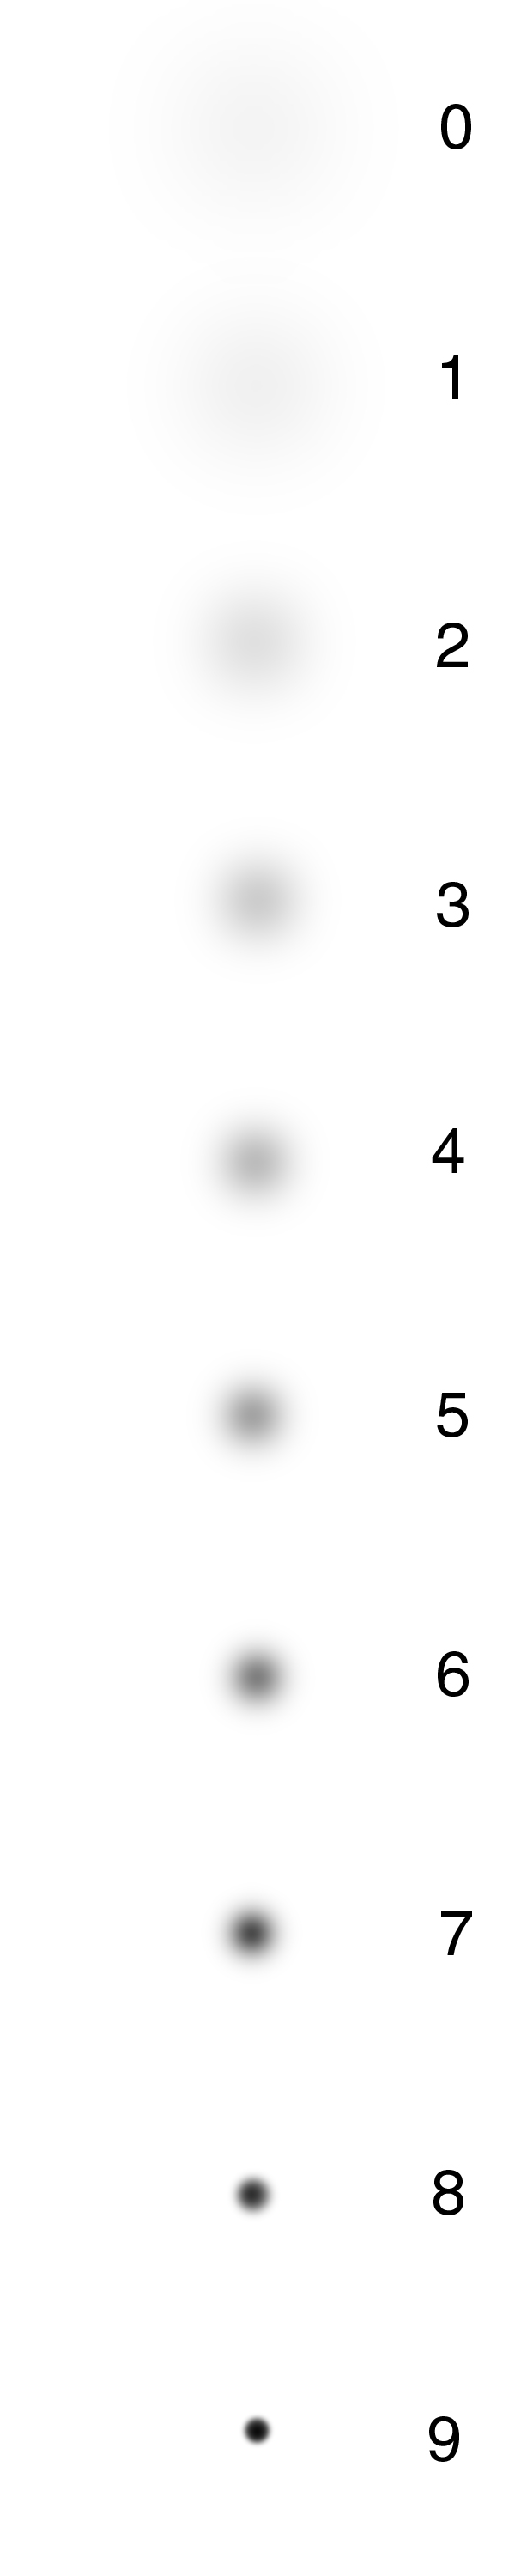
From the point of view of the observer a comet is the blurred object with the surface brightness steadily decreasing from the center outwards, until the merging of the envelope with the background of the sky. In order to determine the degree of blur of comets, astronomers introduced the DC value, which describes the degree of condensation of the comet on the sky background [33] . This value determines the gradient between the center and the edges of the envelope. Comet with DC = 9 looks like a star, while DC = 0 means a flat distribution of brightness, when the surface brightness is almost equal to the surface brightness of the surrounding sky. Comet with DC = 5 has a clear, bright core and a envelope, merging with the background of the sky.
Each comets observer gives in his reports, in addition to estimating the DC, both the total magnitude of the comet, as well as the perceived maximum coma diameter (up to its merging with the background of the sky). Based on these two quantities one can easily calculate the surface brightness of the comet. This means that for the dimmest comets visible in the telescope (binoculars or even the naked eye) with very low DC (0 to 2) its surface brightness can be used as an approximate value of the surface brightness of the sky (specifically, defines it's lower limit).
The main advantage of the described method is its simplicity. Globally, there are hundreds of observers of comets (in Poland, this number reaches tens) and each observer tries to make his observations as carefully as possible, resulting in a large sample of reliable measurements. Each year several comets are observed , which allows for virtually continuous monitoring of the night sky brightness. There is also the possibility of using the archival observations of comets from at least the early twentieth century, allows also to determine the long-term changes in the artificial sky glow level.
It should be emphasized that the estimate of the overall brightness of the comets, as well as the measuring of the envelope diameter, is subjective and may vary depending on the observer. An experienced observer determines the brightness of the overall accuracy of the comet to the 0.2 mag and the diameter envelope to within 20%. As a result, the maximum error designated for such observer is eual to about 0.2 mag/arcsec2, which should be considered an acceptable value.
On the set of described parameters also have a big impact the factors not related to the observer, such as the changing weather conditions. All of these factors, both individual as well as external, make the described method to be considered primarily as a statistical one. It requires, as far as possible, taking into account the many observations made by many observers, but in the case of an experienced observer, able to perform repetitive, reliable observations, and with the right choice of comets (with small brightness and low DC) even the single observation is sufficient to determine the surface brightness of the sky at a given time and place.
Of course, the astronomical method is only suitable for estimating the cloudless sky light pollution, that is, to determine the astronomical light pollution.
For the analysis of light pollution by the cometary method were used the comet observations done by the Polish amateur astronomers, contained in the archive of the Comet Observers Section (SOK) of the Polish Amateur Astronomers Society (PTMA) from the years 1994-2004, as well as observations from the period 2005-2009 from the Centre for the Comet Observations (COK). These observations, sent regularly to the Smithsonian Astrophysical Observatory (Cambridge, Massacusetts, USA), are stored in the database of the International Comet Quarterly Quarterly (ICQ), as well as published in this bulletin [81].
In the years 1994-2009 in the above archives were recorded a total of 10,428 observations of comets, and the annual average 652 observations were made. Richest in this respect was the year 1996 (1907 observations), the poorest 1994 and 2009 (92 and 155 observations).
Due to the nature of the studied phenomenon, for further analysis have been selected only observations of comets weaker than 7 mag, and especially those where the brightness distribution of the envelope is as flat as possible (the DC from 0 to 2). In order to avoid the effect of lightening of the the horizon, as well as associated with dawn or dusk, have been selected comets seen high above the horizon, near the local midnight, at the moonless nights (except for analysis of the night sky surface brightness dependence on the phase of the Moon). In the years 1994-2009 a total of 451 observations meet the above conditions, and thus have been selected for further analysis.
In the case of analysing the changes in the level of light pollution within a certain observation point, so when the observations done by only one observer were used, in order to avoid the random and subjective effects only such observations were used, when the observer made of at least 5 estimates at the time of observation, wherein the two extreme estimates were rejected. To analyze the problem of light pollution level in Poland and its changes in the period 1994-2009 were selected observations of comets according to the above principles. It should be noted that these observations were not dedicated to the discussed problem, so observers certainly could not suggest any established order. Criteria for the selection of comets, relevant to the analysis, allowed for the estimation of the highest Sa recorded in the measuring point, what means the darkest possible sky.
For comparison purposes, were used the base of comet observations made in the years 1984-2009 in Germany and in 1995-2004 in the UK, containing a total of over 20 thousand observation.
The instrumental method
The measurements were performed mainly using a simple-to-use Sky Quality Meter (SQM) produced by Canadian company Unihedron . It is a microprocessor-based frequency signal transmitter of the brightness sensor TSL237, produced by the Texas Advanced Optoelectronic Solutions, Inc. SQM meter microprocessor is programmed so that the reading from the sensor is converted into the commonly used units mag/arcsec2.
The high sensitivity and accuracy of TSL237 within the entire operating range allows the use of the sensor for the measurement of very small streams of light. Since the sensor spectral sensitivity have the maximum at a wavelength of ~ 700 nm, and its characteristic range from ~ 300 nm to ~ 1100 nm, so far in the infrared, SQM meter is additionally equipped with a filter HOYA CM-500, for additional cutoff of the infrared parts of spectrum. This way compensated sensor has a maximum sensitivity at a wavelength of ~ 540 nm, which is approximately the maximum of the color vision (photopic) - 555 nm - with a slight shift in the direction of maximum vision in the dark (scotopic) - 507 nm. This maximum agrees perfectly with a maximum of the V bandwidth of the Johnes-Cousins system, serving in astronomy for photometric measurements corresponding to the sensitivity of the human eye.
Full spectral sensitivity curve of the meter ranges from ~ 300 nm to ~ 740 nm, and the relative sensitivity of over 10% is in the range 340 nm - 680 nm. It is much wider characteristics of all three above-mentioned standards, so The Laboratory of Photometry and Radiometry of Light Pollution (LPLAB) of the Light Pollution Science and Technology Institute (ISTIL) in Thiene, Italy, where the meter has been extensively studied [14], recommended to treat the spectral sensitivity of SQM as one of the many photometric standards used in astronomy .
SQM's are manufactured in four versions: SQM, SQM-L, SQM-LE and SQM-LU. We used mostly the SQM-L (8 meters), which in relation to the version of SQM (2 meters) tested in LPLAB differ by using a simple optical system with the narrow angle of light collection and are therefore more useful in the city. SQM's have a collection angle of 60° from the axis of the instrument, while for the SQM-L the angle is equal only 20°, which is why the former were used for rural stations (JER and ŁUC - explanation below). One used meter SQM-LE has the same parameters as SQM-L - it is only controlled and read out by the computer via the network. In the first two meters reading is triggered manually by pressing the button and the result of measurement is visible on the screen.
We used also a high-sensitivity luxometer SONOPAN L-52. This luxometer has four sensitivity ranges: 1-2000 lx, 0.1-200 lx, 0.01-20 lx and 0.001-2 lx. We used mostly used the last two ranges.
We also used the dielectric layer filter IDA-LPS, designed to cut the spectrum areas where there are major discharge lamp spectral lines causing light pollution (mercury and sodium lamps). The transmittance of the filter was measured in the Department of Photonics at the Jagiellonian University, and compared with a typical spectrum of the night sky in the light polluted area. A the first are of the reduced transmittance, with a minimum at 434 nm, absorbs the 435.8 nm mercury line. The area of a minimum from 540 nm to 550 nm suppresses the strongest 546 nm mercury line . Another area from 580 nm to 595 nm, absorbs the strongest 589 nm sodium line. However, given the fact that in the case of the high-pressure sodium lamps, due to the Doppler effect, this line is very broadened, with the wings extending from ~ 550 nm to ~ 700 nm, the filter does not fulfill its role, particularly since in the center this line is reabsorbed and the lamp is dimmer in this area of spectrum. The last spectrum area with the minimum of at least 622 nm, has damping dimmer sodium two lines 615 nm and 616 nm. So the IDA-LPS filter is suitable for separation only the older light sources (old-style mercury lamps and low pressure sodium lamps) and failed to comply with the hope of separate the natural light the night sky from the artificial one.